Scipy

DataScience
Python
Statistics
Scikit-learn LinearRegression vs Numpy Polyfit
What are differences between linear regression and polynomial regression? We must know these techniques well but it is still vague somewhat.
Read More
DataScience
Python
How to draw support and resistence lines with DataFrame in Python
Support and resistence lines are referred to analyze chart patterns, and a direction of assets for traders. This is a guide to draw those lines in matplotlib.
Read More
DataScience
Python
How to draw a trend line with DataFrame in Python
Talib library doesn’t support to draw trendlines. This is the article how to compute trendlines from DataFrame and draw it in matplotlib.
Read More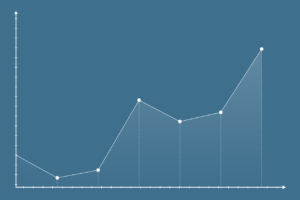
DataScience
Python
How to get a distribution of returns and draw a probability plot for the distribution in Python
It’s crucial to understand the distribution curve of data (asset returns) and if it conforms to the normal distribution. You can learn how to do this in Python.
Read More