Month: September 2020
DataScience
Python
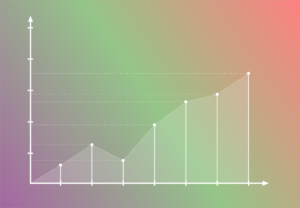
How to draw support and resistence lines with DataFrame in Python
Support and resistence lines are referred to analyze chart patterns, and a direction of assets for traders. This is a guide to draw those lines in matplotlib.
Read More
DataScience
Python
How to draw a trend line with DataFrame in Python
Talib library doesn’t support to draw trendlines. This is the article how to compute trendlines from DataFrame and draw it in matplotlib.
Read More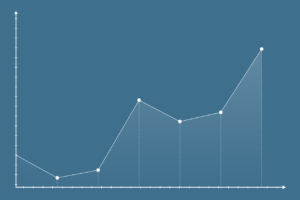
DataScience
Python
How to draw 4 most common trend indicators in matplotlib in Python
Trend indicators are usable and handy for beginners. Here is to introduce how to draw chars and bars for Moving Averages, MACD, RSI and OBV in Python.
Read More
DataScience
Python
How to draw a candlestick chart with DataFrame in Python (mplfinance, plotly and bokeh)
Tutorials how to craw a candlestick from DataFrame object with three different libraries mplfinance, plotly and bokeh.
Read More
Python
Mastering DataFrame – 3 tips for DataFrame.rolling function
Introduce 3 tips in DataFrame about the parameters center and min_periods, how to change the weight of window with win_type, how to use apply function.
Read More
DataScience
Python
How to build Sentiment Analysis with NLTK and Sciki-learn in Python
Sentiment Analysis is one of major applicatioin in machine learning and natural language processing space. This is a guide how to code it in Python.
Read More
DataScience
Python
How to compute price correlation for financial data in Python
We learn how to use Pandas rolling function to calculate rolling change, rolling standard deviation and rolling correlation for financial assets.
Read More
Blockchain
Crypto
Solidity
How to create your own Flashloan in Aave
It took a few bucks to make a huge profit 1,271 ETH that was equivalent to $3,600 at that time with Flashloan. This Flashloan magic sounds indescribable and simply amazed a lot of people when it occurred. There have been some actual transactions in the underlying blockchain and some people really crazed. In this blog, […]
Read More
DataScience
Python
Mastering DataFrame – how to aggregate OHLCV data in a different time period
OHLCV stands for Open, High, Low, Close and Volume (Volume is optional). It’s used for market data such as stock, forex, commodity and crypto and consists of a series of rows that represent 5 data points: the opening and closing price, the highest and lowest price during a certain period of time. Volume is the […]
Read More
DataScience
Python
How to get a distribution of returns and draw a probability plot for the distribution in Python
It’s crucial to understand the distribution curve of data (asset returns) and if it conforms to the normal distribution. You can learn how to do this in Python.
Read More