
OHLCV stands for Open, High, Low, Close and Volume (Volume is optional). It’s used for market data such as stock, forex, commodity and crypto and consists of a series of rows that represent 5 data points: the opening and closing price, the highest and lowest price during a certain period of time. Volume is the total amount traded during that period, which is sometimes an optional point. Traders frequently find insights from OHLC bar chart or the famous candle stick chart that can be created from OHLCV data easily.
In popular OHLC bar chart each row appears as vertical lines over the unit of partucular time, each vertical line on the chart shows the price range (the highest and lowest prices). Tick marks project from each side of the line indicating the opening price on the left, and the closing price for that time period on the right. It depends on traders what interval of sampling they’d like to prefer to. However if you leverage REST API to retrieve financial data or obtain data (excel or csv) from a repository you wouldn’t get a right timeframe data you wanted.
This article is to explain how to aggregate the sampling of OHLCV data of DataFrame object in Python. So you will be able to craft your data to an adquate timeframe for your trading strategy or analysis.
I published 2 articles in the past. Both were how to get OHLCV data from crypto exchanges and how to get OHLCV data for financial data by Pandas Datareader. Here are the links for your reference if you’re curious.
- How to get ohlcv data for your exchange with ccxt library?
- How to get cumulative return for your asset and portfolio in Python
Please get ready for your OHLCV data either one of the financial markets (stock, forex, derivatives, whatever) or one of the crypto tokens (btc, eth, etc). I’ve done a sample snippet to use Datareader here.
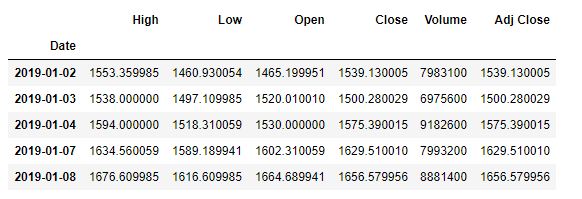
pandas.DataFrame.resample is a convinient function to do resampling time series data for this use. Also we call agg(agg_dict) that is a dictionary parameter in which way we will aggregate column data.
Here’s the exaple the agg_dict dictionary. The keys must be exactly the same strings of DataFrame object and the values are the corresponding function how to aggregate the data with the specified sampling.
agg_dict = {'Open': 'first',
'High': 'max',
'Low': 'min',
'Close': 'last',
'Adj Close': 'last',
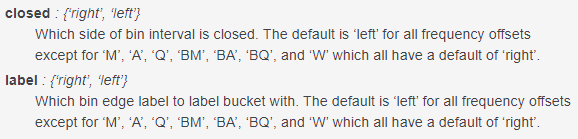
'Volume': 'mean'}Here are some examples I ran on Amazon.com Inc data. Please note that the default is ‘right’ of the closed and label options for the offsets ‘M’, ‘A’, ‘Q’, ‘BM’, ‘BA’, ‘BQ’ and ‘W’ according to the official documentation.
These options may need to be adjusted to avoid unexpected results.
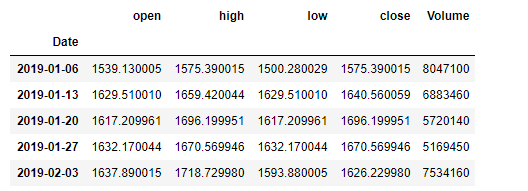
df.resample('W').agg(agg_dict).head()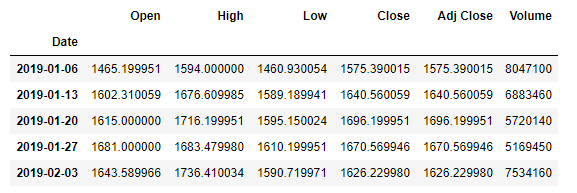
df.resample('W', label='left').agg(agg_dict).head()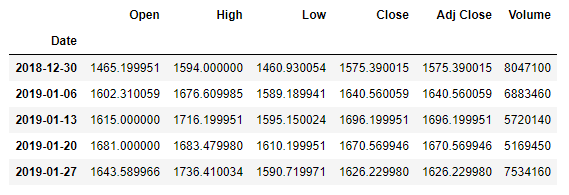
The labels used for the first example were right edge instead of left. In the second example shows the starting label was 2018-12-30 that is the left edge containing the data points until the next label in the bin. The first example the first label 2019-01-06 must have the data points aggregated until the label itself.
Changing the option closed to ‘left’ did not cause any changes for our sample (because the original data does not have the point of 2019-01-06) but basically if you change it to ‘left’ it won’t contain the value it labels. In other words if you have it ‘right’ the aggregated label will include the value on the same data point that is the right side of the bin.
(Optional) How to gain OHLCV data from close prices and volume?
The said example needed OHLCV data to downsample. In this section I’d like to look through how to do the same sampling from the closing prices (or the ticking prices) and volume data only. Let’s start by saying we have DataFrame object with the columns Close and Volume like below.
df_ = df.loc[:, ['Close', 'Volume']]
df_.head()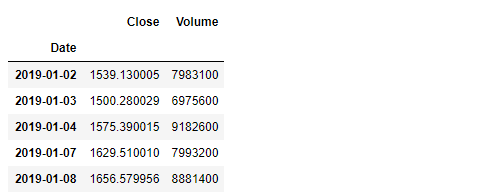
It’s the same resample function we can call but with a different function to compute ohlcv. It’s quite straightforward with the built-in function ohlcv.
Here’s the Jupyter notebook for all samples above for your reference.
Mastering DataFrame – how to aggregate OHLCV data in a different time period
One thought on “Mastering DataFrame – how to aggregate OHLCV data in a different time period”