
As Investopia explains the coefficient of variation is a statistical measure of the dispersion of data points in a data series around the mean. What does this mean in finance and how can this statistics be used to compare asset’s volatility and risk level when you apply the formula for returns of assets.
Assume you’ve got 100 USD stock (the mean price) that might move up and down 1 USD (the standard deviation) everyday and at the same time you’ve got 1 Bitcoin (let’s say the mean price is about 10,000 USD) that might move up and down 1,000 USD (the standard deviation). Image you have both assets in your account.
Which would you think more riskier? Those assets have the different mean and the different standard deviation. But intuitively we can know Bitcoin is more high volatile and riskier, here’s a mystery. How did we come to know this? This is exactly the coefficient of variation does in our mind, which is relative dispertion of prices (or returns) around the mean price in certain period of time.
In this guide, I’d like to show how to scrape crypto data via CoinGecko API and clense it to calculate coefficient of variation for various crypto assets. You may do the same for price and returns of other assets easily. Let’s get started.
Crawl CoinGecko API to obtain data
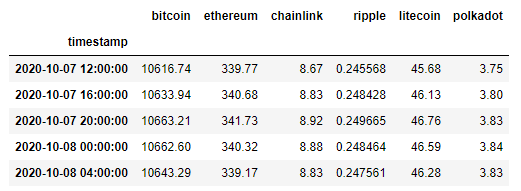
Let’s extract OHLC data and use only the Close row to calculate daily returns in Pandas DataFrame. CoinGecko has a lot of programming SDKs but I’d like to call a simpler REST API in https in a Python code.
I used /coins/{id}/ohlc endpoint. We must specify id of token, vs_currency usd and days. Candle intervals depend on what days you set in calling an API.
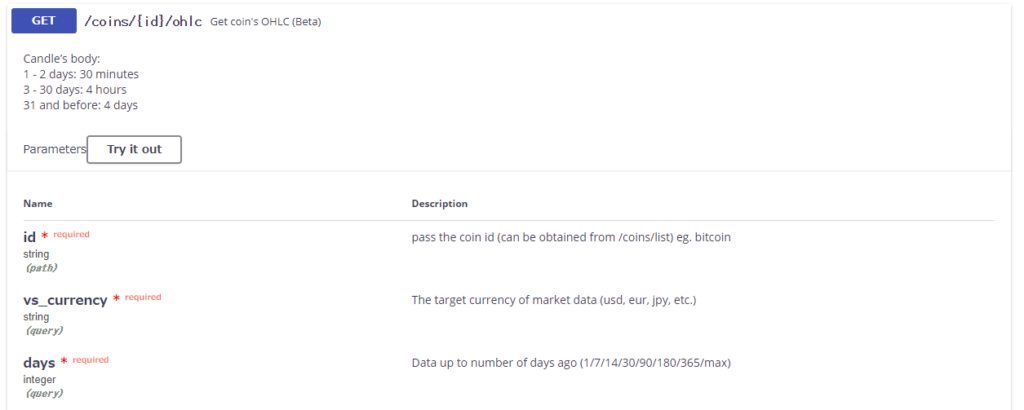
Here’s the example code to obtain 30 days OHLC data for the coins that are Bitcoin, Ethereum, Chainlink, Ripple, Litecoin, and Polkadot. I pick these coins because these have been rankers for a while.
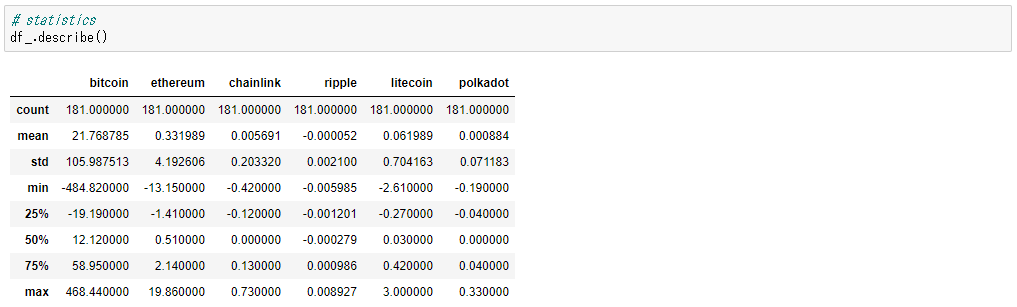
describe is a cool function to calculate the summary statistics of the given DataFrame. It returns counts of observations, mean, standard deviation, min and max values, also percentiles 25%, 50% (median) and 75%. Now we’re close to the end.
Calculate coefficient of variation and draw a bar plot
Let’s repeat that the coefficient of variation is the ratio of the standard deviation to the mean of samples or observations (you can apply this formula for both). As we saw stats, we can use DataFrame function to calculate each asset’s coefficient of variation as below.
# calculate coefficient of variation,
# represents the ratio of the standard deviation to the mean
cv = pd.DataFrame(df_.std()/df_.mean())
cv.columns = ['Coef']
This is the sample code to calculate the coefficient of variations and draw a bar plot to compare crypto assets which one the better the risk-return trade-off. In general, a lower ratio of the standard deviation to the mean would be the better for investor’s preference, however it depends on what is her/his risk acceptance level for asset type. If she prefers to take riskier assets in crypto investment, then a higher ratio of coefficient of variation would be also good.
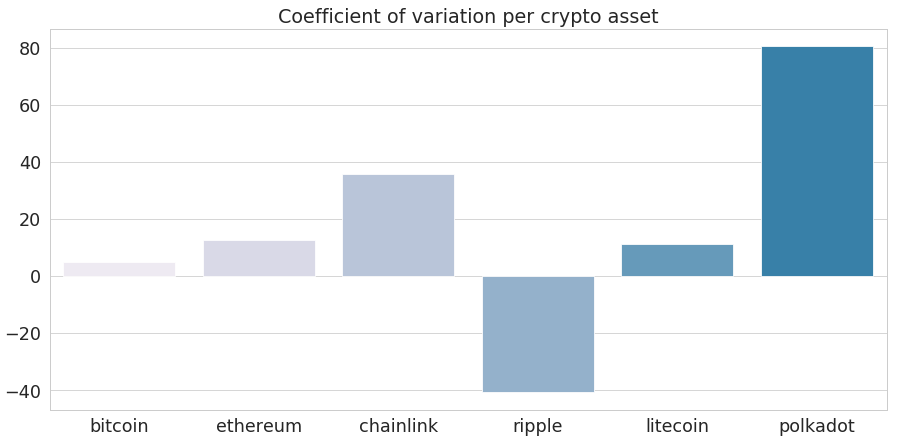
Based on the approximate figures, the investor might invest in Bitcoin, Litecoin or Ethereum as a result, since the risk/reward ratios are approximately the same and indicate a balanced risk-return trade-off than others. Ripple shows negative coefficient variance, that means off course the mean valus of the returns were minus.