
If you have a financial portfolio it’s crucial to calculate your portfolio cumulative return to manage your portfolio. In this blog I’d like to introduce how to calculate cumulative return with Pandas cumprod function in Python.
- How to calculate cumulative return for single asset
- How to calculate cumulative return for your portfolio
Who’s the readers?
You need basic understanding of Python programming language and the library Pandas for this article.
How to use Pandas Datareader
In this example I used Pandas Datareader to fetch daily stock data. The symbol information is updated on this FTP server in text for Nasdaq.
Download the latest symbols from Nasdaq.
Let’s collect these common stock prices from Nasdaq as you want. It’s a list of companies I chose for purpose. You can select your assets from the text file if you want.
AAPL|Apple Inc. – Common Stock
AMZN|Amazon.com, Inc. – Common Stock
CCEP|Coca-Cola European Partners plc Ordinary Shares
FB|Facebook, Inc. – Class A Common Stock
JNJ|Johnson & Johnson Common Stock
JWN|Nordstrom, Inc. Common Stock
NVS|Novartis AG Common Stock
PG|Procter & Gamble Company (The) Common Stock
I defined a function that returns multi-index ['Ticker', 'Date'] DataFrame just by giving an array of stock tickers with start date and end date in datetime.
The function is declared and can be used as following. gist shows how to write this function in Python.
getMultiAssetData(tickerList, date_from, date_to)
It’s a multi-index DataFrame. If you want to retrieve only single asset, you can call loc method to slice the data. This is how to get Apple Inc. data from this multi-index DataFrame. Sweet.
df.loc['AAPL', :]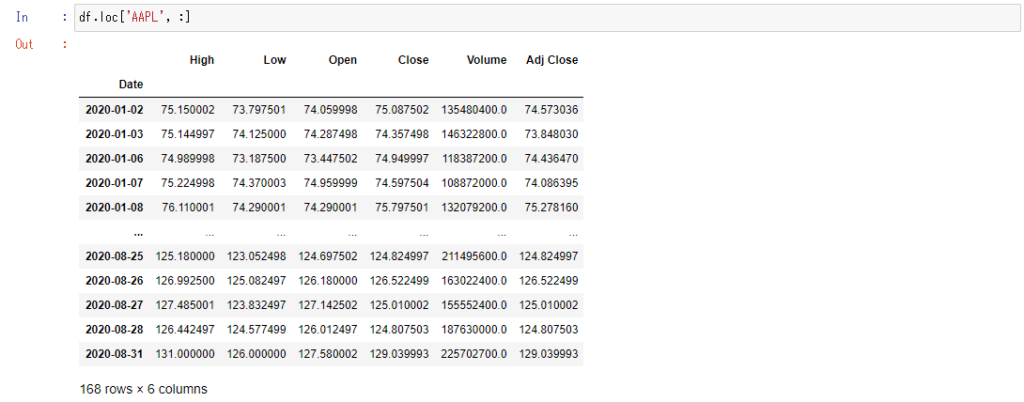
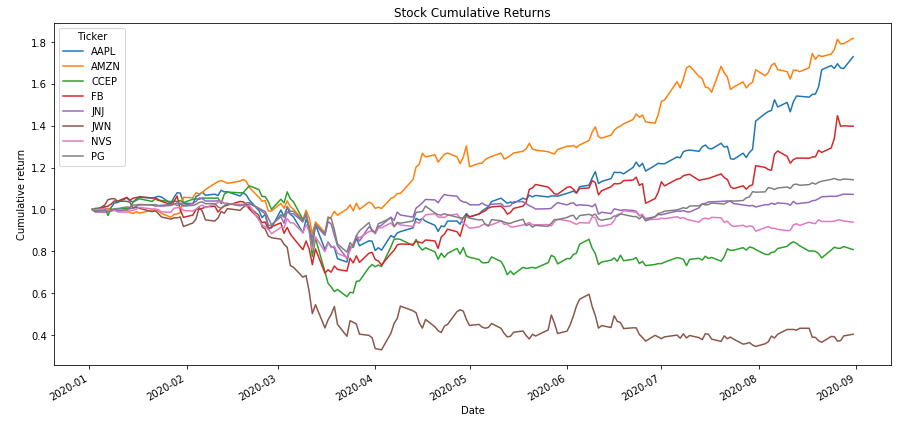
How to calculate cumulative return for single asset
Let’s take the adjusted closing price and reshape this multi-index DataFrame into single index DataFrame with the columns that are tickers now. Then we will take 2 steps to calculate cumulative returns for each single asset.
- Calculate Daily percent change for this DataFrame
- Calculate Cumulative product for the percent change + 1
Here’s the example.
How to calculate cumulative return for your portfolio
Let’s think the collected stocks are assets of your portfolio. We need to create a vector for our asset weights and calculate the weighted returns for the assets. The portfolio return will be the sum of the weighted returns. We can use the cumprod() function to calculate cumulative returns for the overall portfolio now. The process is the same basically.
- Calculate Daily percent change for this DataFrame
- Calculate Cumulative product for the percent change + 1
An asset weight is determined as below.
AAPL|Apple Inc. – Common Stock 15%
AMZN|Amazon.com, Inc. – Common Stock 15%
CCEP|Coca-Cola European Partners plc Ordinary Shares 5%
FB|Facebook, Inc. – Class A Common Stock 20%
JNJ|Johnson & Johnson Common Stock 15%
JWN|Nordstrom, Inc. Common Stock 5%
NVS|Novartis AG Common Stock 15%
PG|Procter & Gamble Company (The) Common Stock 10%
Here’s the example.
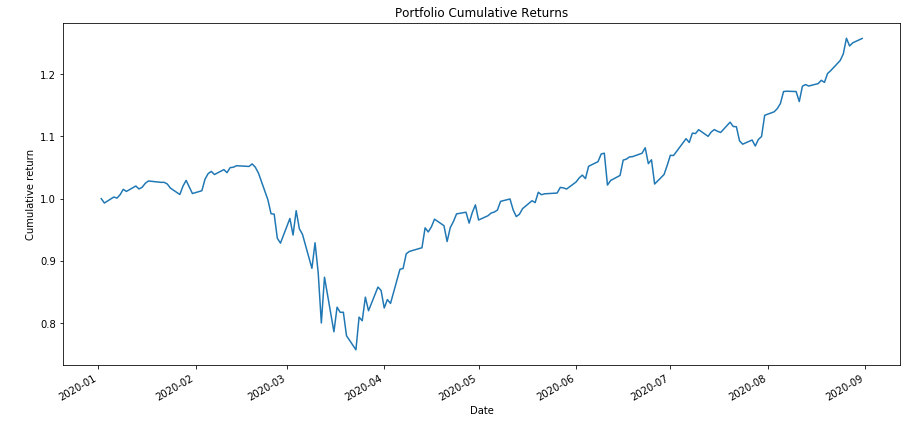
Viola. The result looks smooth and stable with 8 stocks. At last it has reached 120% that is close to Facebook performance. Here’s the Jupyter notebook for all samples above for your reference.
How to get cumulative return for your asset and portfolio in Python
4 thoughts on “How to get cumulative return for your asset and portfolio in Python”